Contents
- •Before You Begin
- 1Downloading and Installing the Platform
- 2Opening a Demo Account
- 3Logging In to a Live Account
- 4The Main Screen: A Map of the Platform
- 5The Top Menus and the Toolbar
- 6Market Watch and Adding Symbols
- 7The Contract Specification: The Most Important Window
- 8Charts, Timeframes and Indicators
- 9The Eight Order Types
- 10Opening a Trade and Reading Your Account
- 11Modifying and Closing a Trade
- 12History and the Journal
- 13Useful Shortcuts and Settings
- 14MetaTrader 5 on Your Phone
- 15Common Error Messages
- 16Checklist Before Your First Live Trade
Introduction
Before You Begin#
MetaTrader 5 (MT5) is a trading platform developed by MetaQuotes and offered by hundreds of brokers worldwide. The platform is the same for everyone; what differs is the server you connect to — in other words, the broker.
- The platform is not the broker. It is software that displays prices and transmits your orders. Your money is held by the broker, not by the platform.
- Every screenshot in this guide was taken from the generic version of the platform, on a demo account with virtual funds on the MetaQuotes demo server, and is not tied to any broker. Colors or window layout may differ slightly at your broker, but the functions are identical.
- The platform interface is shown in English, as it is the most widely used. You can change the language from View → Languages.
Learn everything in this guide on a demo account first. Do not open your first live trade until you have opened, modified and closed dozens of demo trades, and read the contract specification of every instrument you intend to trade.
Chapter 1
Downloading and Installing the Platform#
Where to download it#
| Device | The right source |
|---|---|
| Windows | Your broker's official website (preconfigured for its servers), or the platform's official website, metatrader5.com. |
| Mac | Your broker's website or the official platform website. |
| iPhone and Android | The “MetaTrader 5” app on the App Store or Google Play, published by MetaQuotes. |
| Web browser | The web version, via a link provided by your broker. |
Never download the platform from a link someone sent you on WhatsApp or Telegram, or from any site other than your broker's or the platform's official website. Fake platforms look identical to the real one and display fictitious profits. On your phone, make sure the publisher is MetaQuotes.
Installing on Windows#
- Run the installer you downloaded, accept the terms, and click Next until the end.
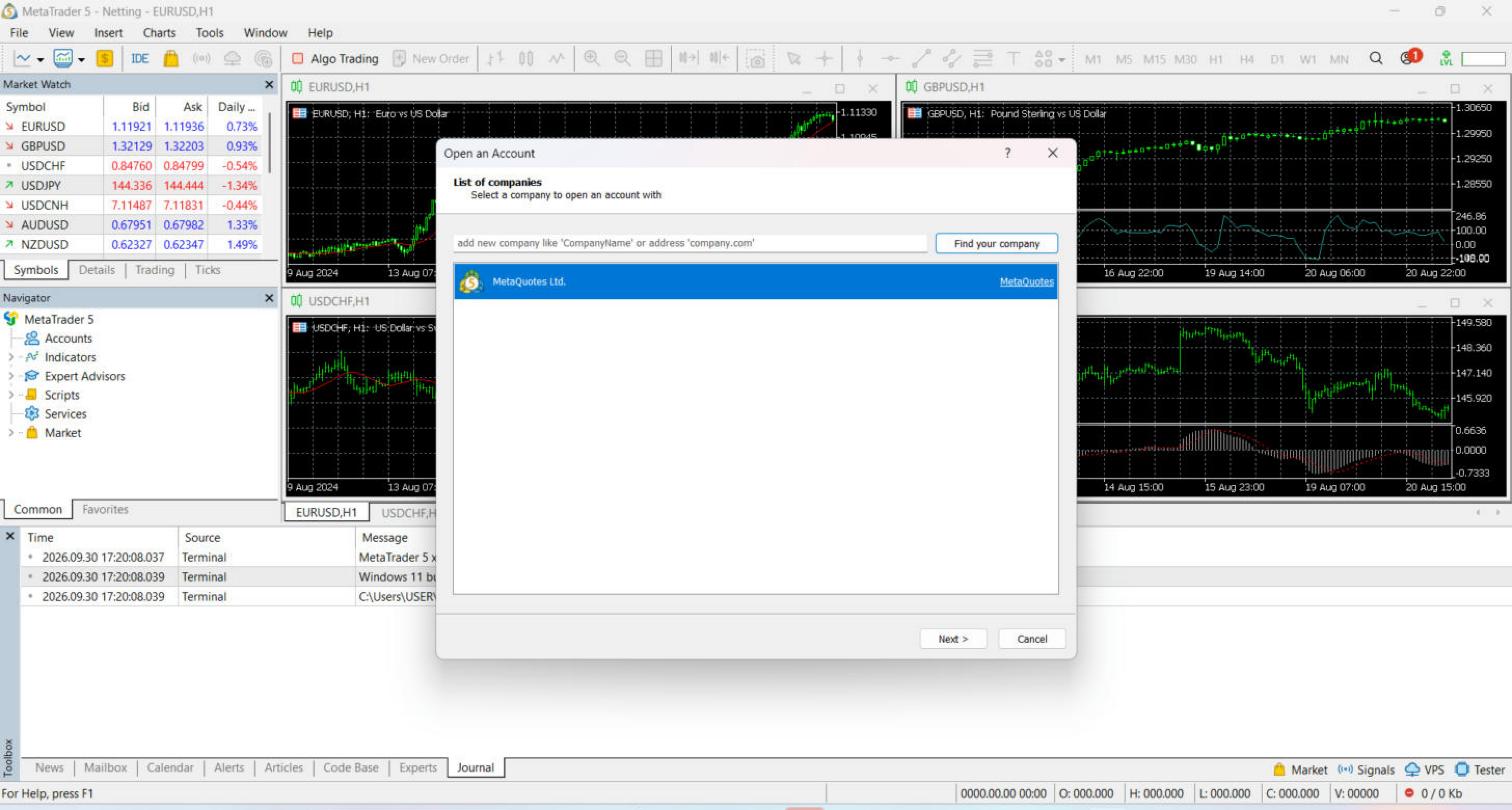
- On first launch, the platform automatically opens the “Open an Account” window so you can choose a company and open an account (Chapter 2).
- If it does not appear, open it from the menu: File → Open an Account.
Chapter 2
Opening a Demo Account#
A demo account is free, uses virtual money and live prices, and takes less than a minute to open from inside the platform.
Step 1: Choose the company#
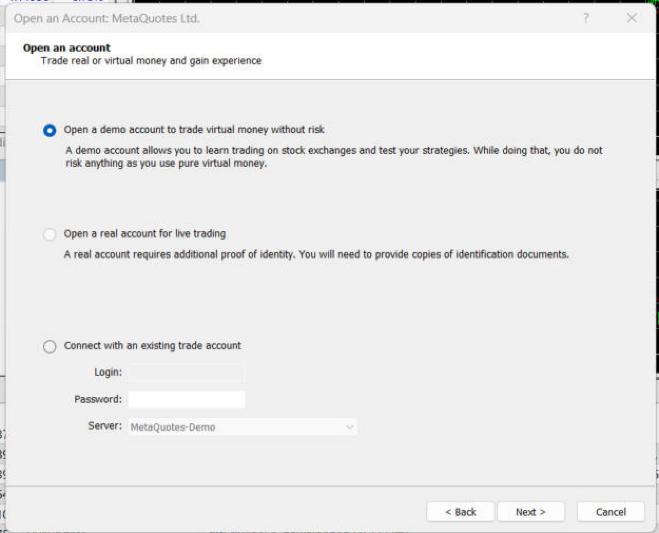
Step 2: Account type#
Step 3: Your details#
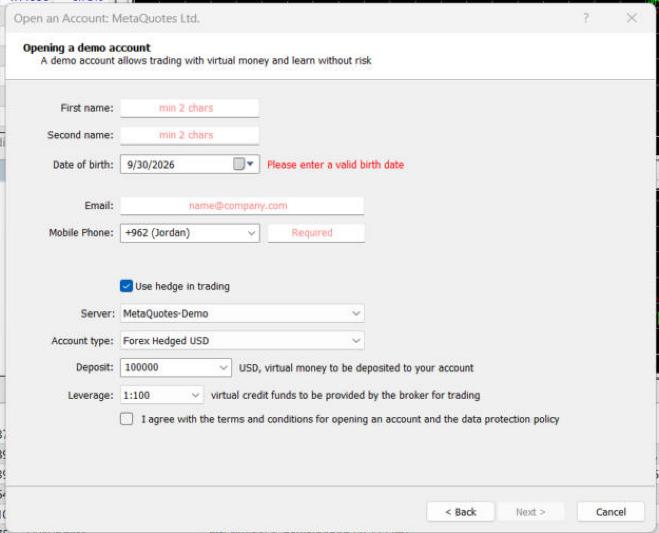
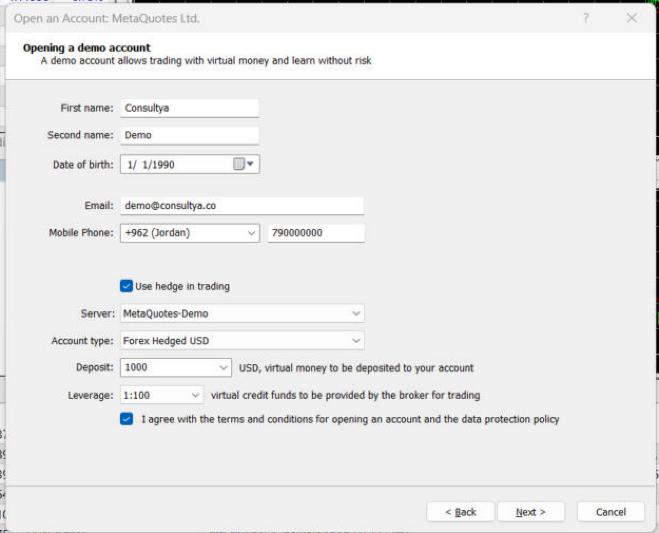
| Field | What to choose and why |
|---|---|
| Name, email and phone | Identification details for the demo account. |
| Use hedge in trading | Checked = a “Hedging” account, which allows more than one position on the same symbol, even in opposite directions. Unchecked = a “Netting” account, in which positions are merged into a single net position. Most retail brokers use Hedging. |
| Account type | The account type and its currency (US dollars here). |
| Deposit | The virtual balance. Choose an amount close to what you will actually deposit (for example $1,000), not $100,000 — so you get used to realistic position sizes and losses. |
| Leverage | Choose the leverage you will use on your live account. |
Step 4: The account is ready#
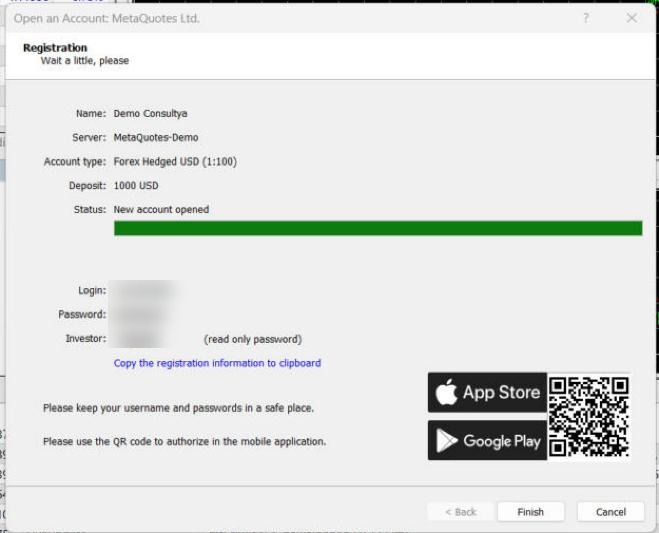
| Item | What it is |
|---|---|
| Login | Your account number. You need it to log in from any device. |
| Password | The trading password: it opens and closes trades. Never share it. |
| Investor | A read-only password: anyone who logs in with it can see the account but cannot trade. This is the one to share if you want someone to review your account. |
| Server | The name of the broker's server. Without it, the account cannot connect. |
Click “Copy the registration information to clipboard”, save the details somewhere safe, then click Finish.
Chapter 3
Logging In to a Live Account#
A live account is usually not opened from inside the platform but on the broker's website. The platform is simply where you log in afterwards.
- Register with the broker on its official website and complete identity verification (a copy of your ID and proof of address).
- Choose the account type (standard, or raw spread with commission), the leverage and the account currency in the broker's client area.
- Deposit funds using a payment method in your own name (see our article “How to Choose a Broker”).
- Receive your account details: the account number, password and server name, by email or in the client area.
- Log in from the platform: File → Login to Trade Account, or the third option in the “Open an Account” window, “Connect with an existing trade account” (screenshot in Chapter 2), then select the correct server.
After logging in, look at the title bar at the top of the platform: it shows the account number, the server name and the account type (Demo or Real). The server name must match what your broker sent you and must carry the name of the company you signed up with.
Chapter 4
The Main Screen: A Map of the Platform#
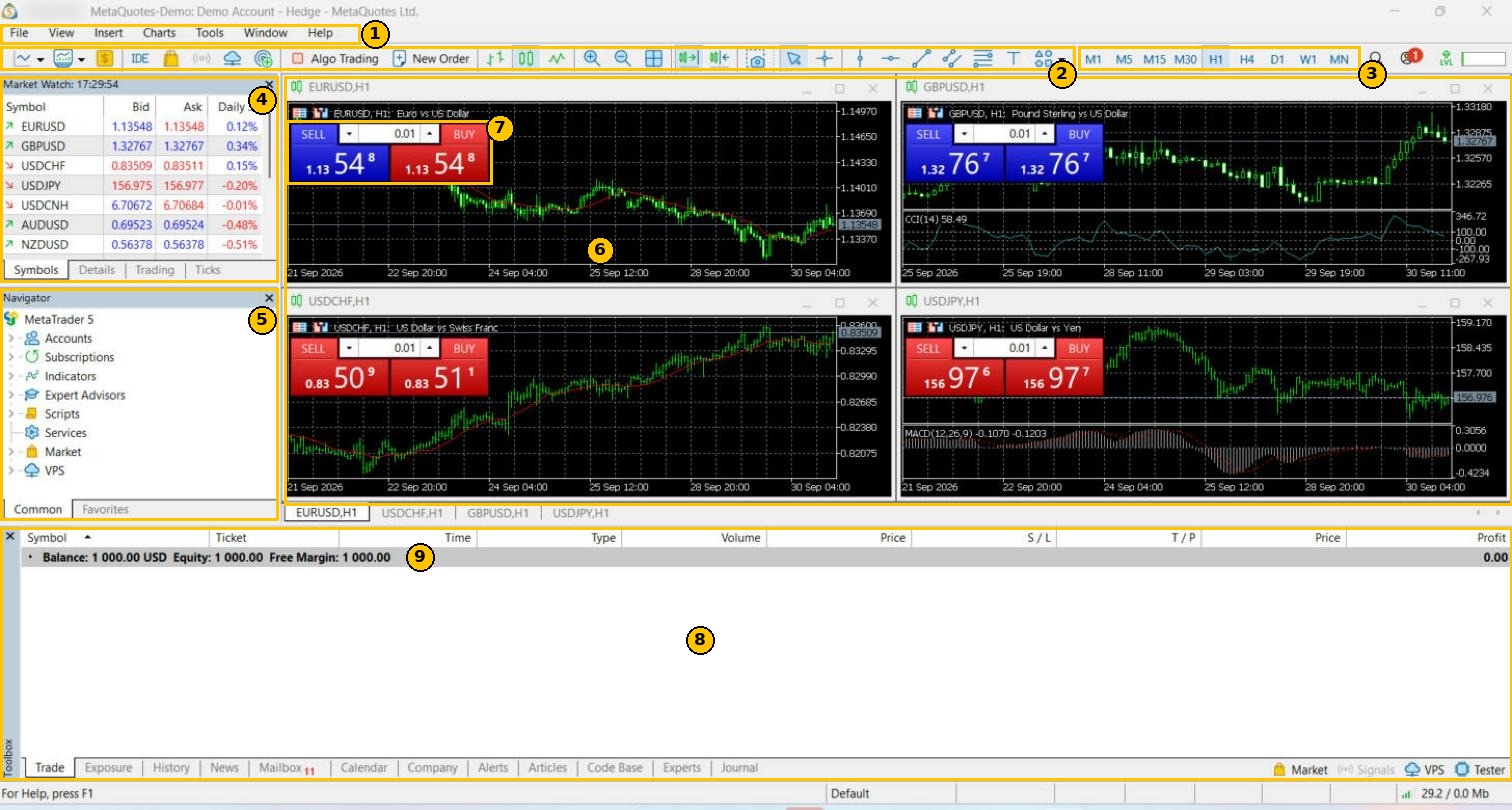
| # | Area | What it does |
|---|---|---|
| 1 | Menus | File (accounts and login), View (windows and language), Insert (indicators and tools), Charts (chart settings), Tools (options). |
| 2 | Toolbar | Chart type, templates, New Order, Algo Trading (runs automated programs), zoom in and out, and drawing tools (lines, channels, Fibonacci, text). |
| 3 | Timeframes | M1 (one minute), M5, M15, M30, H1 (one hour), H4, D1 (one day), W1 (one week), MN (one month). Each candle represents that period. |
| 4 | Market Watch | Symbols with their bid and ask prices and daily change (Chapter 6). |
| 5 | Navigator | Accounts, indicators, automated programs (Expert Advisors) and scripts. |
| 6 | Chart area | You can open several charts and switch between them using the tabs below. |
| 7 | One Click Trading panel | SELL and BUY buttons and a volume box directly on the chart. They execute with a single click — be careful (Chapter 13). |
| 8 | Toolbox | Tabs: Trade (open positions), History, Journal and more. Show or hide it with Ctrl+T. |
| 9 | Account line | Balance, equity, margin, free margin and margin level (Chapter 10). |
Chapter 5
The Top Menus and the Toolbar#
There are seven menus across the top of the platform: File, View, Insert, Charts, Tools, Window and Help. You will not need everything in them, but you should know where everything is.
The toolbar#


| Icon (from left) | What it does |
|---|---|
| The first two icons with drop-down menus | Open a new chart for any symbol, and manage saved chart layouts. |
| $ (Symbols) | The Symbols window — same as Ctrl+U. |
| IDE | MetaEditor, for writing indicators and automated programs in the MQL5 language. |
| The briefcase and the icons after it | MQL5 services: the Market, Signals and Virtual Hosting. |
| Algo Trading | Turns automated programs on or off. A red square = disabled. Leave it off unless you are running an automated program you understand. |
| New Order | The New Order window — same as F9. |
| Three green icons | Chart type: bars, candlesticks, line. |
| Magnifier + and magnifier − | Zoom the chart in and out. |
| The four squares | Tile the open charts side by side. |
| The scroll and shift arrows | Auto Scroll: the chart follows the latest price automatically. Chart Shift: leaves empty space on the right of the chart. |
| The camera | Save a screenshot of the chart. |
| The arrow and the + sign | The normal cursor, and the Crosshair for measuring the distance between two points in points and candles. |
| Drawing tools | Vertical line, horizontal line, trendline, equidistant channel, Fibonacci, text and shapes. |
| M1 … MN | Timeframes, from one minute to one month. |
| The last magnifier and the bell | Search within the platform, and notifications and messages. |
The File menu#
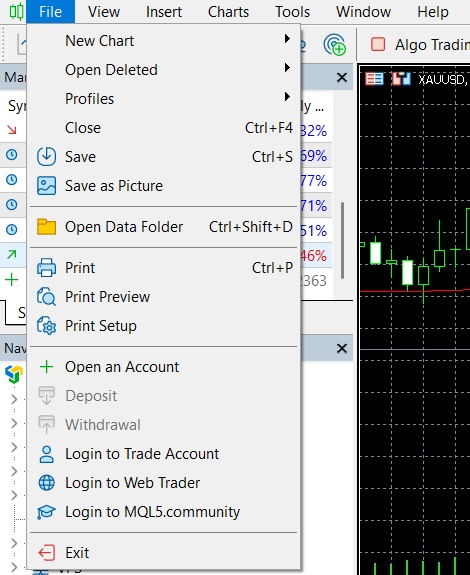
| Option | Function |
|---|---|
| New Chart | A new chart for any symbol. |
| Open Deleted | Restore a chart you closed. |
| Profiles | Save your set of charts and their layout, and restore it. |
| Close (Ctrl+F4) | Close the current chart. |
| Save (Ctrl+S) | Save the chart's price data to a file. |
| Save as Picture | Save an image of the chart. |
| Open Data Folder | The platform's file folder: indicators, programs and templates. |
| Print … | Print the chart. |
| Open an Account | Open a demo or real account (Chapter 2). |
| Deposit / Withdrawal | Deposits and withdrawals, if the broker has linked them to its client area (greyed out here). |
| Login to Trade Account | Log in to an existing account (Chapter 3). |
| Login to Web Trader | Open the account in the browser version. |
| Exit | Close the platform. |
If the Deposit and Withdrawal options are active, they are simply links to your broker's client area. Always deposit and withdraw through your broker's official website — never through a link someone sent you.
The View menu#
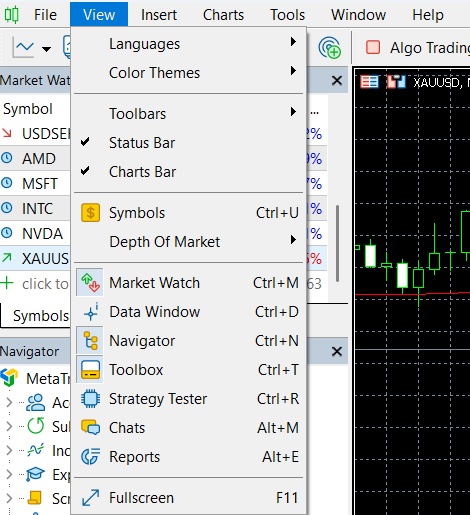
| Option | Function |
|---|---|
| Languages | The platform language, including Arabic. |
| Color Themes | Light or dark appearance. |
| Toolbars / Status Bar / Charts Bar | Show or hide the bars. |
| Symbols (Ctrl+U) | All available symbols. |
| Depth Of Market | Market depth. |
| Market Watch (Ctrl+M) | The Market Watch window. |
| Data Window (Ctrl+D) | Candle and indicator values exactly under the mouse cursor: open, high, low and close. |
| Navigator (Ctrl+N) | The Navigator. |
| Toolbox (Ctrl+T) | The Toolbox. |
| Strategy Tester (Ctrl+R) | Test automated programs on historical data. |
| Reports (Alt+E) | An account performance report with figures and charts. |
| Fullscreen (F11) | The chart in full screen. |
The Insert menu#
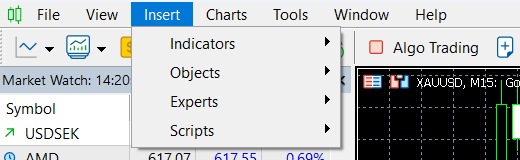
- Indicators: grouped by category — Trend (such as moving averages), Oscillators (such as RSI and MACD), Volumes, Bill Williams, and Custom (indicators you have added yourself).
- Objects: the same drawing tools as on the toolbar, and more.
- Experts: automated programs (Expert Advisors).
- Scripts: small programs that run once (for example, to close all positions).
The Charts menu#
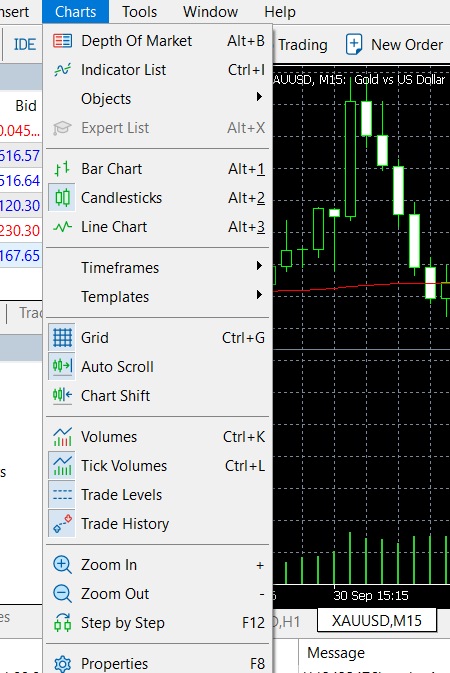
| Option | Function |
|---|---|
| Indicator List (Ctrl+I) | The indicators on the chart, to edit or delete them. |
| Objects | A list of the drawings on the chart, and a way to delete them all at once. |
| Bar / Candlesticks / Line | Chart type (Alt+1/2/3). |
| Timeframes | The chart timeframe. |
| Templates | Save a chart's settings and indicators, and apply them to other charts. |
| Grid (Ctrl+G) | Show or hide the grid. |
| Auto Scroll / Chart Shift | Automatic scrolling, and the space on the right of the chart. |
| Volumes / Tick Volumes | Show volume below the chart. |
| Trade Levels | Show position and order lines on the chart. |
| Trade History | Show your past trades on the chart with entry and exit arrows — excellent for reviewing your performance. |
| Zoom In / Out | Zoom in and out. |
| Step by Step (F12) | Advance the chart one candle at a time. |
| Properties (F8) | Colors, and showing the Ask price line. |
The Tools menu#
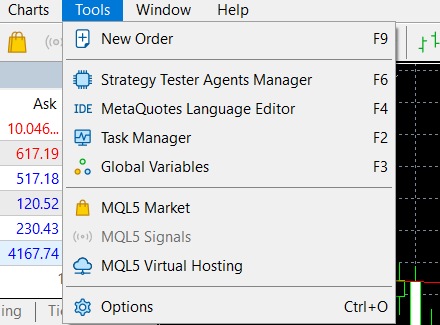
| Option | Function |
|---|---|
| New Order (F9) | A new order. |
| MetaQuotes Language Editor (F4) | The editor for indicators and programs. |
| Task Manager (F2) | The platform's use of your computer's resources. |
| Global Variables (F3) | Variables used by automated programs. |
| MQL5 Market / Signals / Virtual Hosting | The store for indicators and programs, the signal-copying service, and hosting. |
| Options (Ctrl+O) | All platform settings: server, trading, charts and notifications (Chapter 13). |
The Signals service automatically copies another trader's trades into your account. Do not subscribe to any signal before you fully understand its track record and risks.
The Window and Help menus#
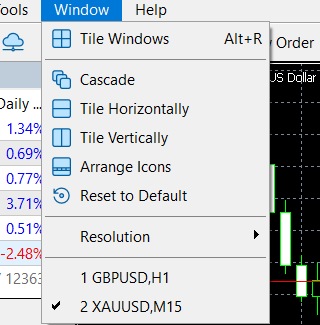
- Tile Windows (Alt+R): arrange all charts side by side.
- Cascade / Tile Horizontally / Vertically: other arrangements.
- Reset to Default: restore the default window layout if things get mixed up.
- At the bottom of the menu: a list of open charts to switch between them.
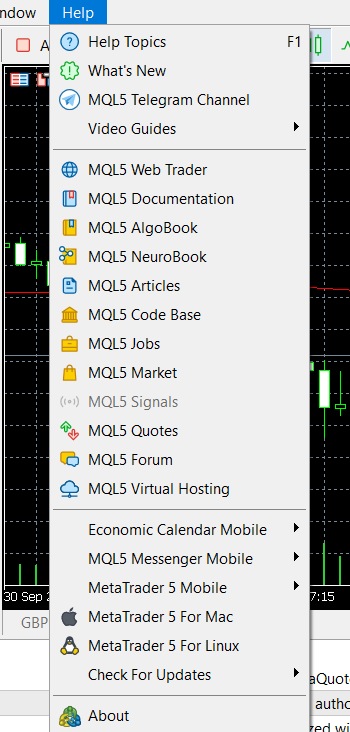
- Help Topics (F1): the complete official platform manual.
- Video Guides: official tutorial videos.
- MQL5 …: links to the MQL5 community: documentation, articles, code base and forum.
- MetaTrader 5 Mobile / For Mac / For Linux: download links for the other versions.
- Check For Updates: update the platform.
- About: the platform's version number.
Chapter 6
Market Watch and Adding Symbols#
For each symbol, the Market Watch window shows the Bid (the price at which you sell), the Ask (the price at which you buy) and the Daily Change (the change since the start of the day). The difference between the Ask and the Bid is the spread.
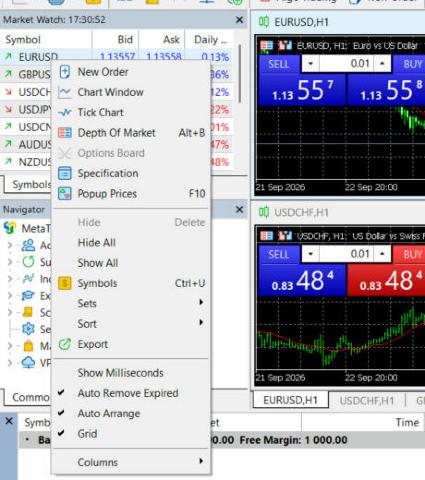
The key menu items
- New Order: the New Order window.
- Chart Window: open a chart of the symbol.
- Depth Of Market: market depth (if your broker provides it).
- Specification: the contract specification (Chapter 7).
- Symbols (Ctrl+U): all available symbols.
- Show All / Hide All: show or hide all symbols.
Adding a symbol (for example, gold)#
- The quick way: at the bottom of the Market Watch list there is a “+ click to add” row. Click it, type XAUUSD and press Enter.
- The full way: Ctrl+U → type the symbol name in the search box → select it → Show Symbol → OK.
Symbol names vary slightly between brokers: XAUUSD, GOLD, XAUUSD.m or XAUUSD+. Extra characters usually indicate a different account type.
Chapter 7
The Contract Specification: The Most Important Window#
Right-click the symbol → Specification. This window contains everything that determines the value of each price move, your costs and your margin. Read it before your first trade on any symbol.
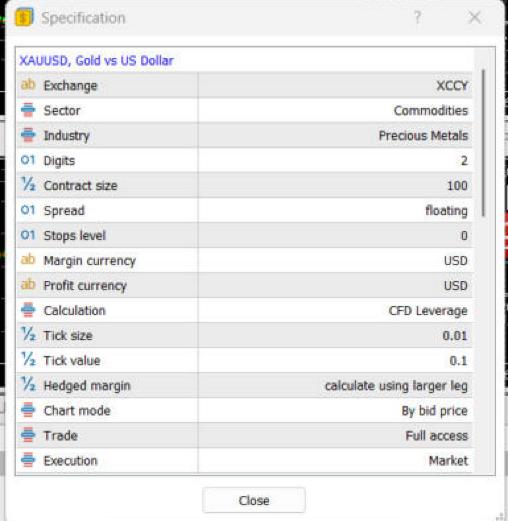
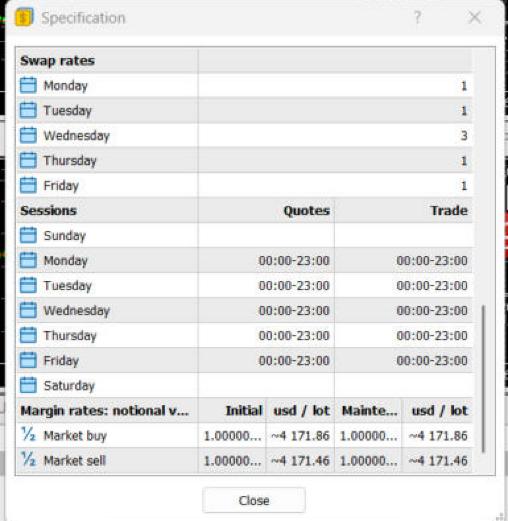
| Item | In the screenshot | What it means |
|---|---|---|
| Digits | 2 | The number of decimal places: a price of 4170.65. |
| Contract size | 100 | One lot = 100 ounces, so every $1 move = $100 per lot. |
| Spread | floating | The spread varies with the market; it is not fixed. |
| Stops level | 0 | The minimum allowed distance between the price and your stop loss or take profit. 0 = no restriction. |
| Tick size / Tick value | 0.01 / 0.1 | The smallest price move (one cent) and its value per lot (ten cents). In other words, one platform “point” on gold = $0.01. |
| Execution | Market | The execution type: at the best available price. |
| Swap rates | Wednesday 3 | The overnight swap is charged three times on Wednesday night. |
| Sessions | 00:00–23:00 | Quoting and trading hours, in the broker's server time. |
| Margin rates | ~$4,171 / lot | The margin required for one full lot at this leverage (1:100) — about $41.70 for a 0.01-lot position. |
The middle part of the window (between the two screenshots) shows the long and short swap values (Swap long / Swap short) and how they are calculated — scroll the window to read them.
Chapter 8
Charts, Timeframes and Indicators#
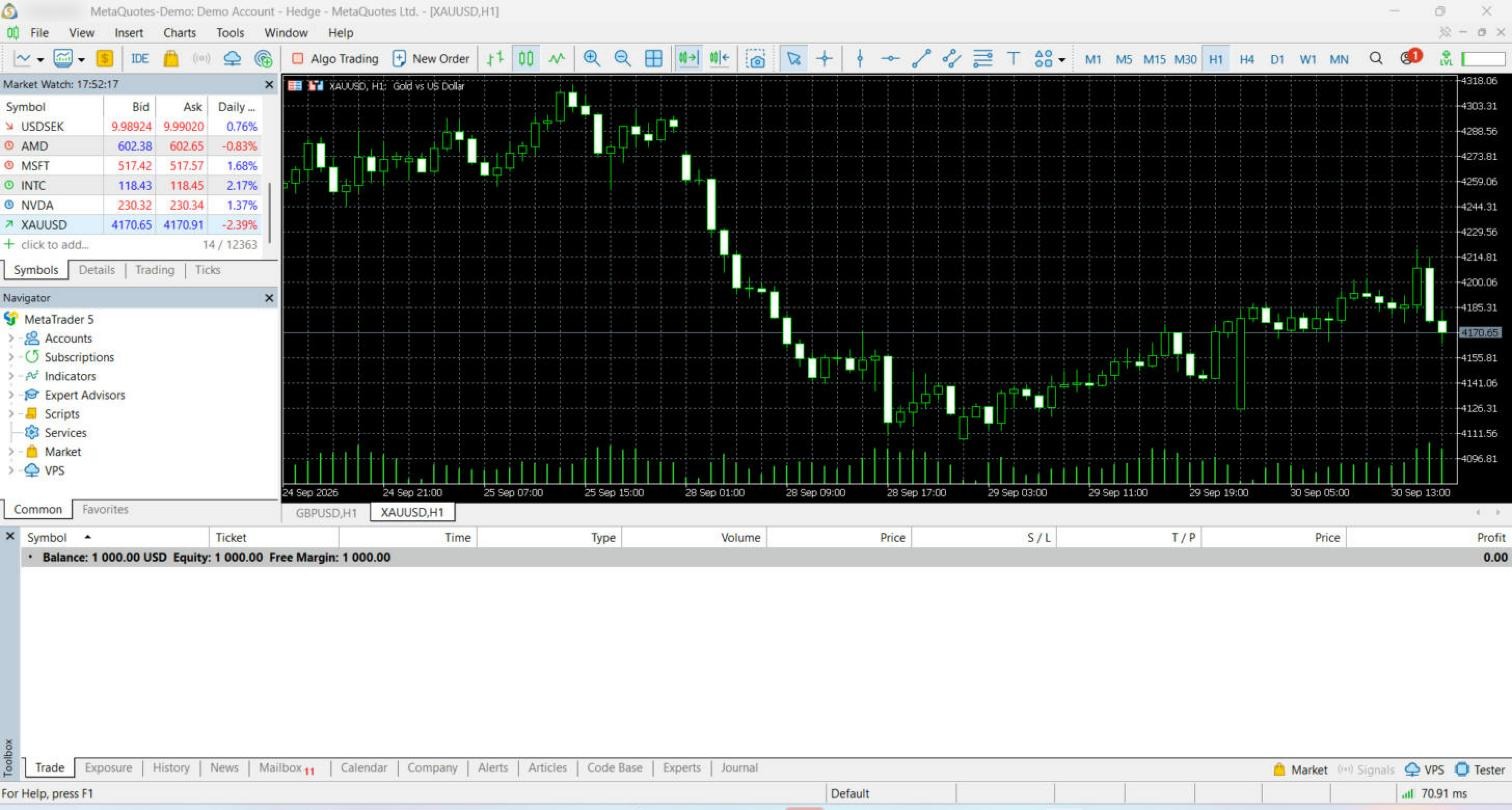
Opening and setting up a chart#
- Open a chart: right-click the symbol in Market Watch → Chart Window, or drag the symbol into the chart area.
- Maximize the chart: double-click its title bar, or use the maximize button.
- Timeframe: use the M1 to MN buttons on the top bar.
- Chart type: bars (Alt+1), candlesticks (Alt+2), line (Alt+3).
- Zoom: the + and − buttons, or the mouse wheel.
- Show the Ask line: F8 → Show tab → Show Ask line. This matters because the chart plots the Bid price only.
Adding an indicator#
Insert → Indicators → Trend → Moving Average. The settings window opens:
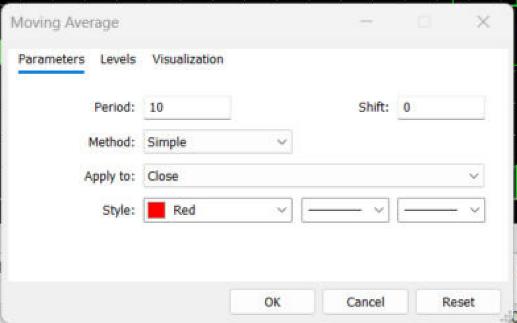
- Period: the number of candles used in the calculation (for example, 200).
- Method: Simple, or Exponential (which gives more weight to the most recent candles).
- Apply to: the price used (usually the close).
- Style: line color and thickness.
To remove an indicator: right-click the chart → Indicators List (Ctrl+I) → select it → Delete.
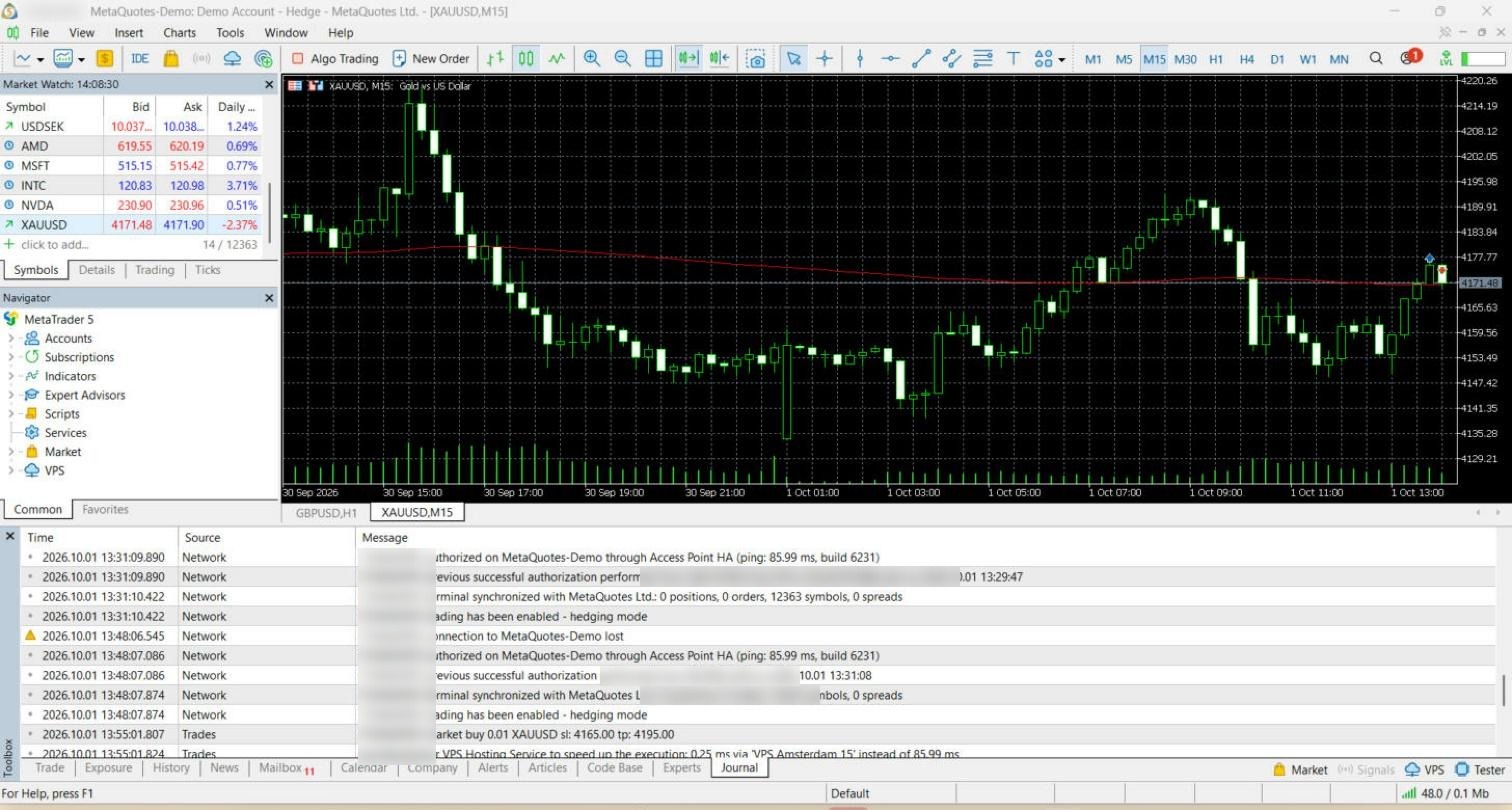
Drawing tools#
On the top bar: horizontal line, vertical line, trendline, channel, Fibonacci and text. Select the tool, then click on the chart. To delete a drawing, double-click it and press Delete.
Chapter 9
The Eight Order Types#
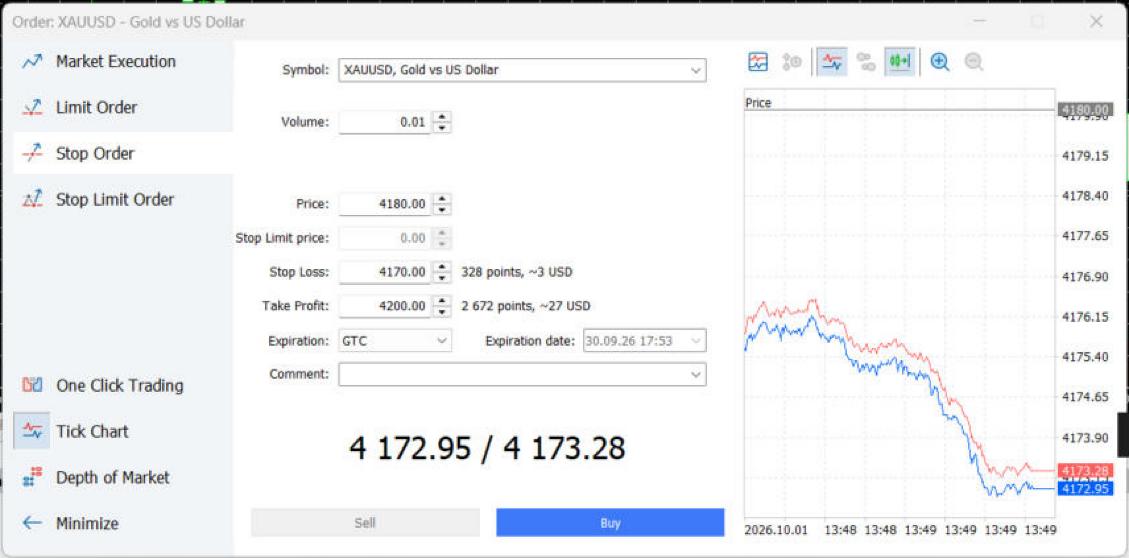
The order window (F9 or New Order) has four tabs on the left. Each tab is an order type, and each type has a buy version and a sell version — eight orders in all. The platform decides between “buy” and “sell” automatically, depending on where the price you enter sits relative to the current price.
The complete table#
| Order | When it executes | When to use it |
|---|---|---|
| Buy (Market) | Immediately, at the current Ask | You want to buy now. |
| Sell (Market) | Immediately, at the current Bid | You want to sell now. |
| Buy Limit | If the price falls to your level (below the current price) | You expect a bounce up from support: “buy for me cheaper.” |
| Sell Limit | If the price rises to your level (above the current price) | You expect a pullback down from resistance: “sell for me higher.” |
| Buy Stop | If the price rises and breaks through your level (above the current price) | You expect the rally to continue after resistance breaks. |
| Sell Stop | If the price falls and breaks your level (below the current price) | You expect the decline to continue after support breaks. |
| Buy Stop Limit | When the price reaches the trigger level (above), a Buy Limit is placed at a price you set (below the trigger) | You want to enter after the breakout, but on a small pullback rather than at any price. |
| Sell Stop Limit | When the price reaches the trigger level (below), a Sell Limit is placed at a price you set (above the trigger) | You want to sell after the breakdown, on a small pullback. |
Limit = “at a better price”: buy lower or sell higher, against the current move. Stop = “with the move”: buy higher or sell lower, after a breakout. Limit orders have one advantage: they fill at their price or better, and never slip against you.
1. Market Execution#
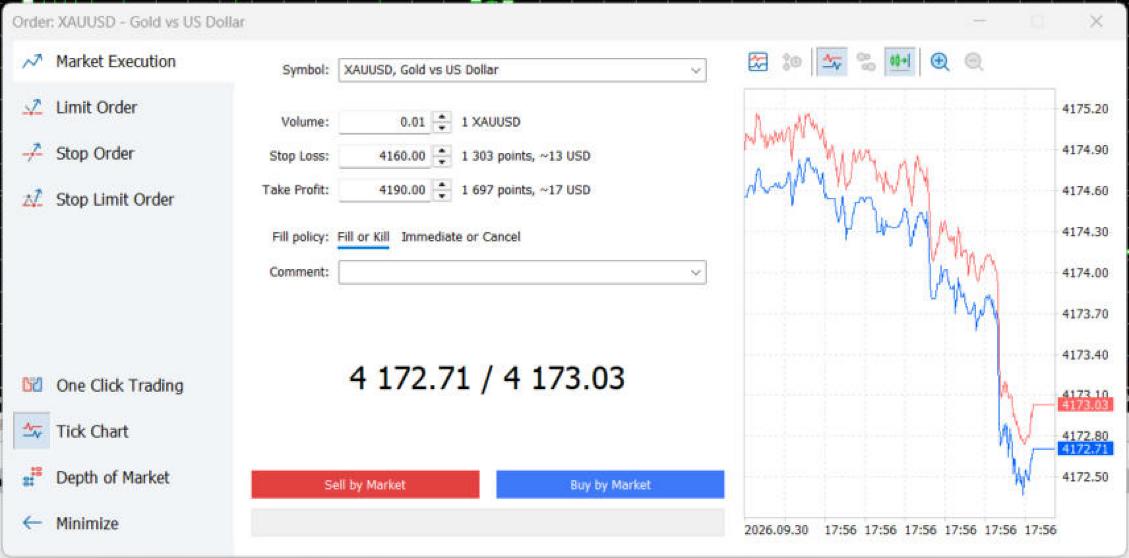
| Field | Meaning |
|---|---|
| Symbol | The symbol. |
| Volume | The size in lots (0.01 = one ounce of gold). |
| Stop Loss / Take Profit | Your stop and your target. Next to each one, the platform shows the distance in “points” ($0.01 on gold) and the value in dollars — check them before you click. |
| Fill policy | Fill or Kill: the full volume is filled or the order is cancelled. Immediate or Cancel: whatever is available is filled and the rest is cancelled. |
| Comment | An optional note that appears in your history. |
2. Limit Order#
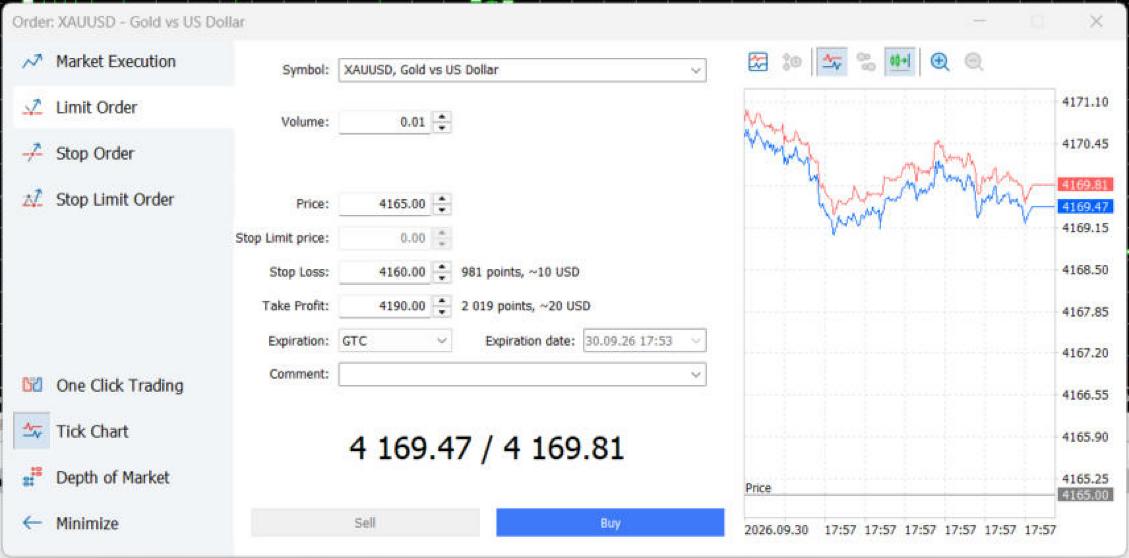
- Price: the price at which the order executes.
- Expiration: how long the pending order remains valid: GTC (until you cancel it), Today (until the end of the day), Specified (until a date and time you set), Specified day (until the end of a day you set).
3. Stop Order#
4. Stop Limit Order#
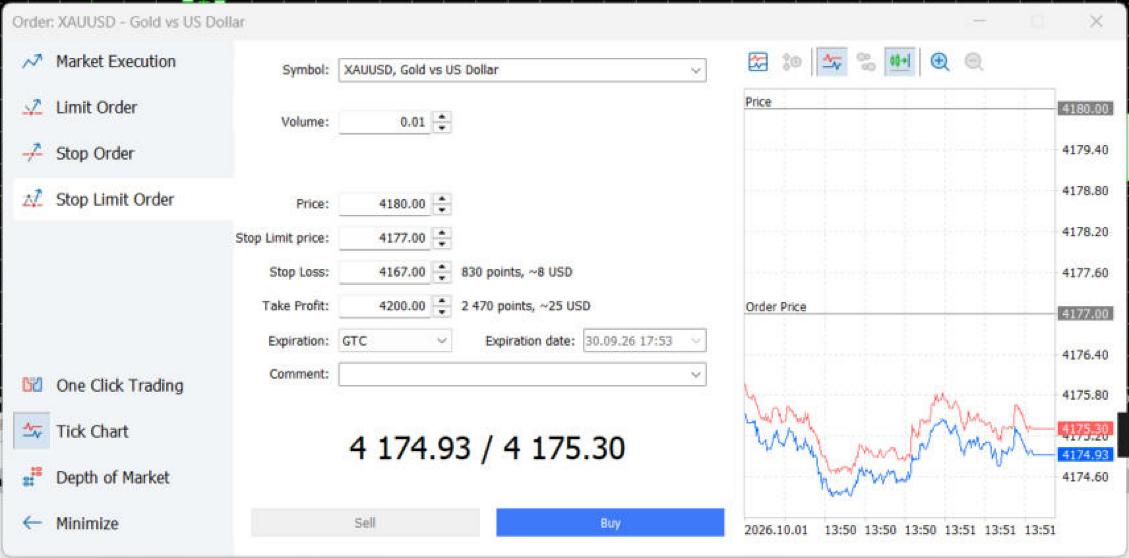
In plain terms: “If the price reaches 4180, place a buy limit order at 4177.” You wait for the breakout as confirmation, then enter on a small pullback instead of buying at the top of the surge. The risk: if the price takes off after the breakout without pulling back to 4177, you will not be filled.
Orders attached to every position#
| Order | What it is |
|---|---|
| Stop Loss | A stop order that closes your position at your loss limit. It executes as a market order, so it can slip during news and price gaps. |
| Take Profit | A limit order that closes your position at your target, at that price or better. |
| Trailing Stop | A moving stop that follows the price at a fixed distance as it moves in your favor. Set it by right-clicking the position → Trailing Stop. Note: it only works while the platform is open and connected on your computer. |
Chapter 10
Opening a Trade and Reading Your Account#
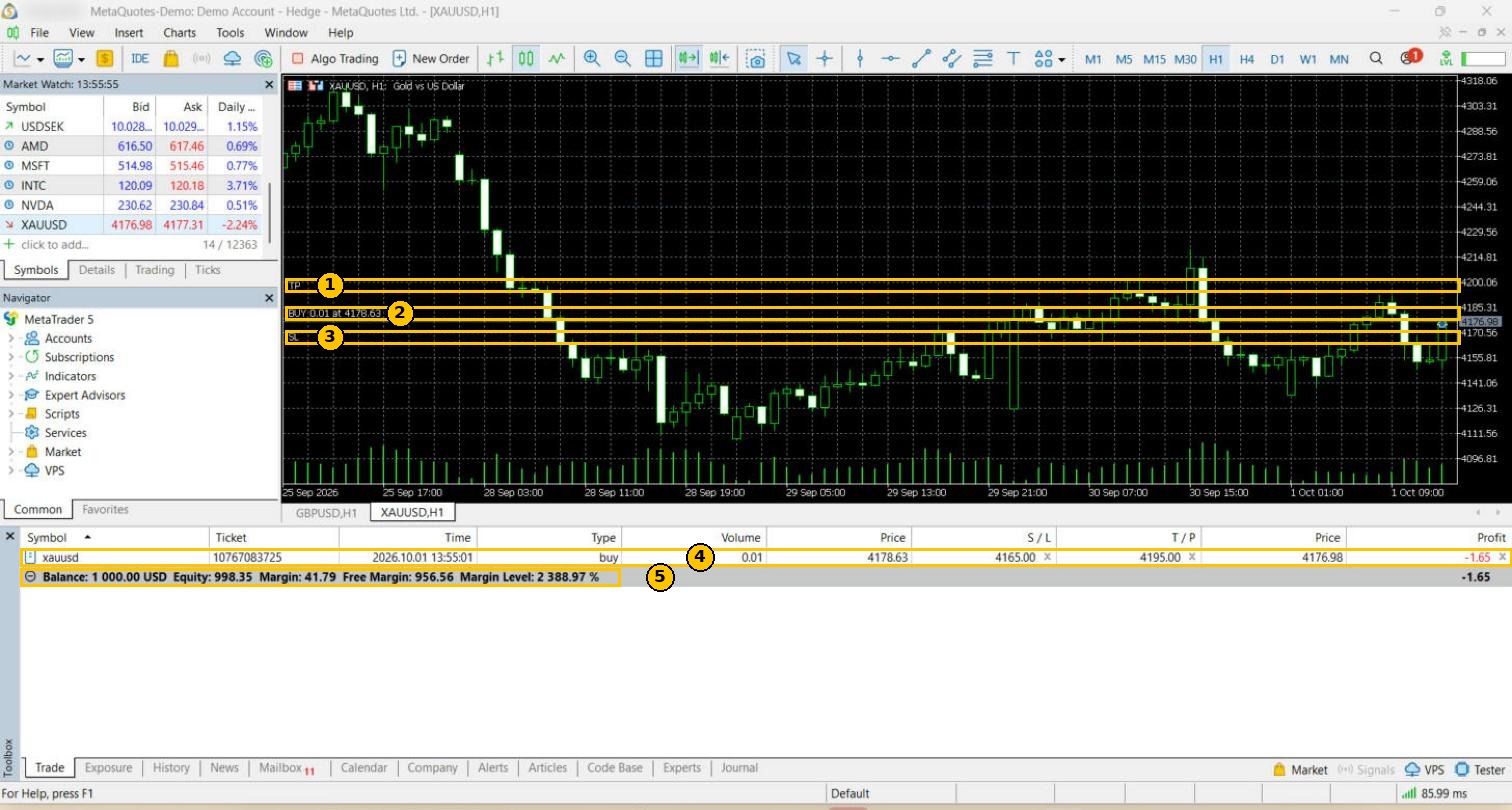
In the market order window: volume 0.01, stop loss 4165, take profit 4195, then Buy by Market. A confirmation message appears:
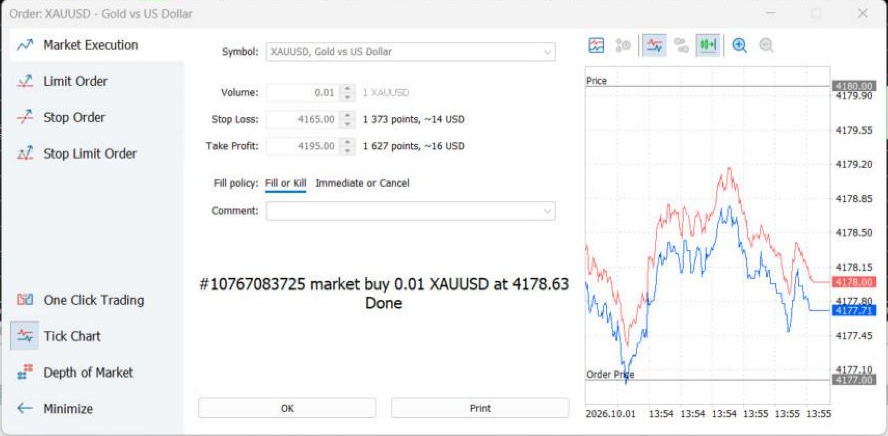
| # | What you see | Meaning |
|---|---|---|
| 1 | TP line | The target at 4195. |
| 2 | BUY 0.01 at 4178.63 | The entry price. You can drag the stop-loss and take-profit lines with the mouse to modify them. |
| 3 | SL line | The stop at 4165. |
| 4 | Position row | Symbol, ticket number, open time, type (buy), volume, entry price, stop loss, take profit, current price, and floating profit or loss. |
| 5 | Account line | See the next table. |
Reading the account line — with the actual figures from the screenshot#
| Item | Value | Where it comes from |
|---|---|---|
| Balance | $1,000.00 | The deposit; no trade has been closed yet. |
| Equity | $998.35 | Balance + floating loss (−$1.65) = 998.35. |
| Margin | $41.79 | 100 oz × 0.01 × 4178.63 ÷ 100 (leverage) = 41.79. |
| Free Margin | $956.56 | Equity − margin = 998.35 − 41.79. |
| Margin Level | 2,388.97% | Equity ÷ margin × 100%. A very high figure = a safe account, far from a stop out. |
The floating loss of −$1.65 at the moment of the screenshot comes from the spread and price movement: the buy was filled at the Ask, and a buy position closes at the lower Bid.
Chapter 11
Modifying and Closing a Trade#
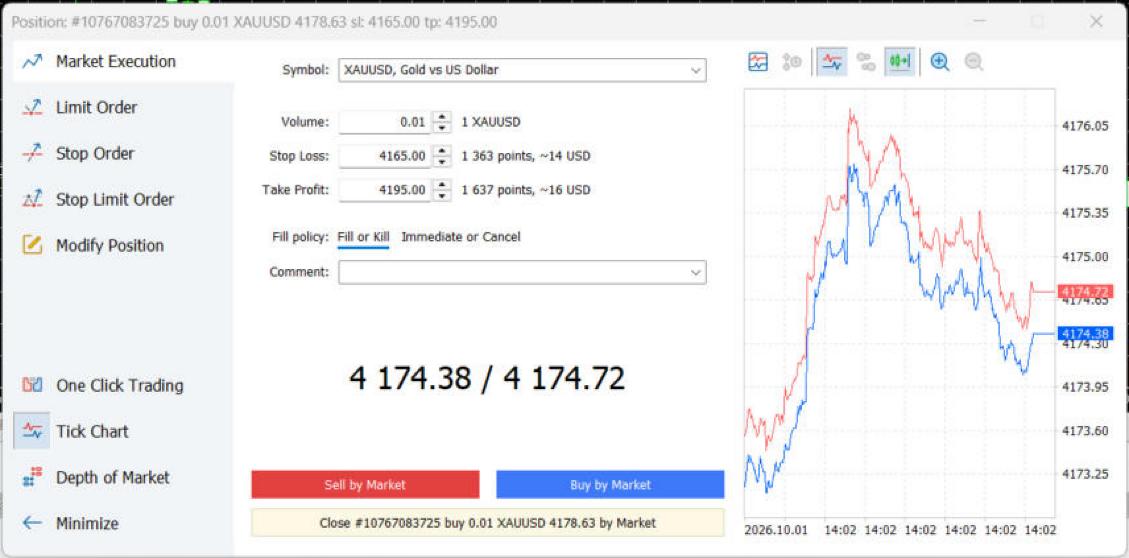
Double-clicking the position row opens the Position window:
Modifying the stop loss and take profit#
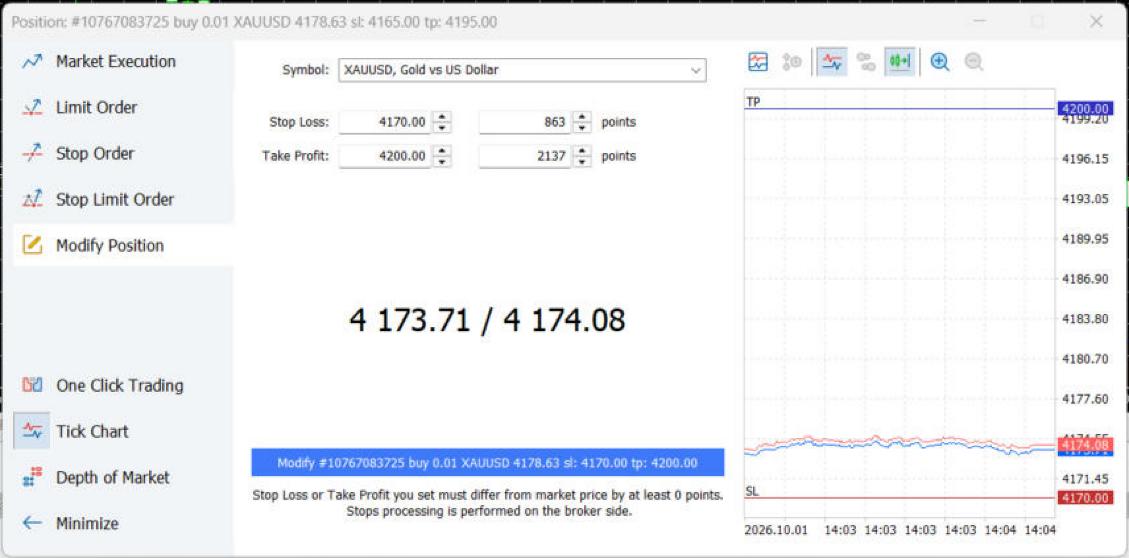
- A faster way: drag the stop-loss or take-profit line on the main chart with the mouse, or click the × next to their values in the position row to remove them.
- The message at the bottom of the window — “Stops processing is performed on the broker side” — means your stop loss and take profit are executed by the broker's server even if you close the platform (unlike the trailing stop).
Closing#
- Full close: the yellow “Close #… by Market” button, or the × at the end of the position row.
- Partial close: change the volume in the Position window before clicking the close button (for example, close 0.01 of 0.03) — this is how you take a third of the position off at each target.
- Close By (with an opposite position): on Hedging accounts, you close a buy position against a sell position on the same symbol, saving one spread.
Chapter 12
History and the Journal#
History#
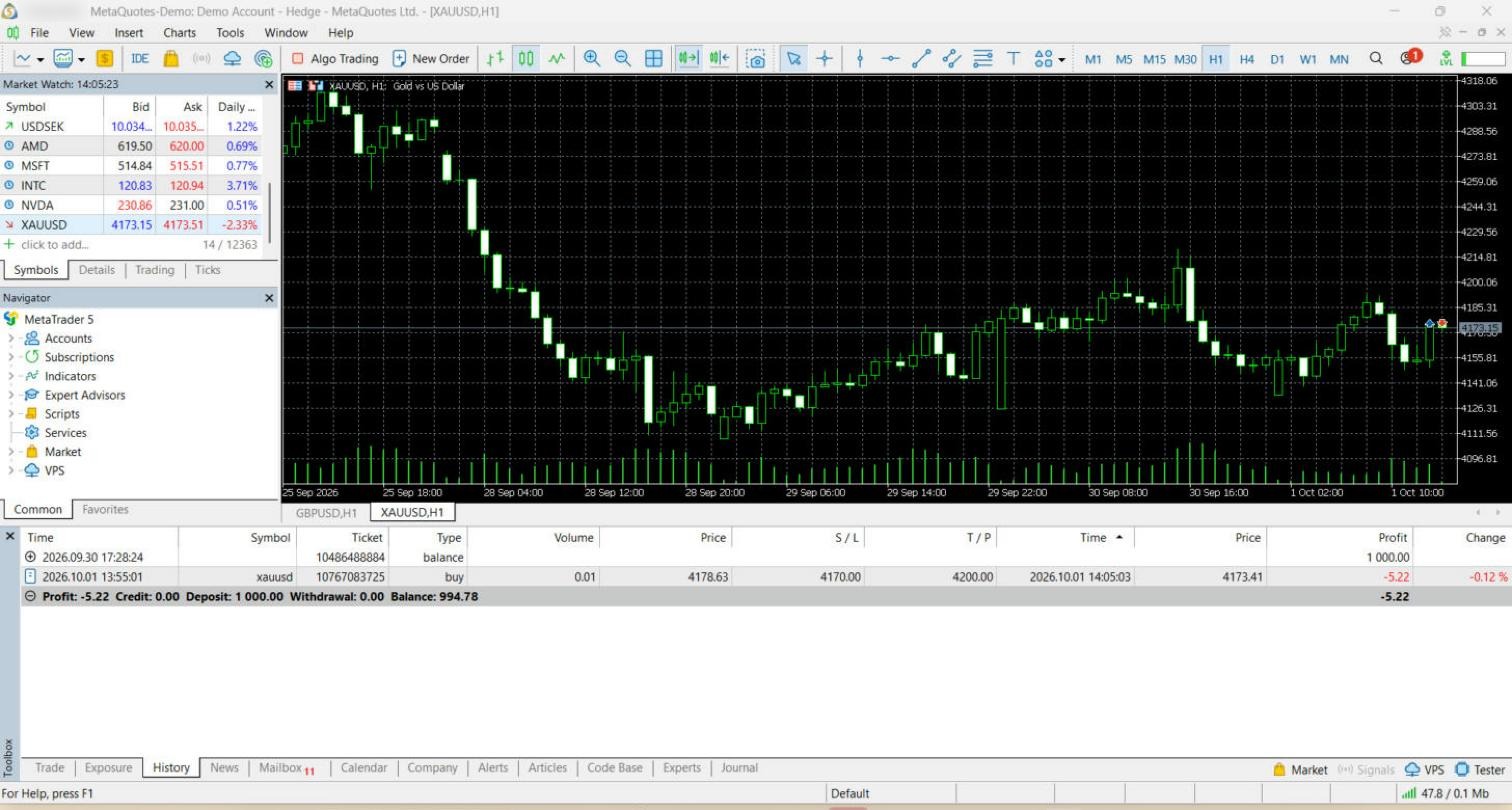
| What you see | Meaning |
|---|---|
| balance · 1,000.00 | The initial deposit. |
| buy 0.01 · 4178.63 → 4173.41 | The entry and exit prices, with the modified stop loss and take profit (4170 and 4200). |
| Profit −5.22 | (4173.41 − 4178.63) × 100 × 0.01 = −$5.22. |
| Balance 994.78 | The balance after the position was closed. |
- Right-click the history → choose the period (today, this week, this month, or a custom period).
- Right-click → Report: a full performance report you can save. It shows the requested and executed prices of stop-loss, take-profit and pending orders — useful for measuring slippage.
The Journal#
A log of everything the platform does: connecting to the server, every order sent and its result, and every error. When an order is rejected or something unexpected happens, this is where you will find the reason (see the screenshot in Chapter 8). The Experts tab is the equivalent log for automated programs.
Chapter 13
Useful Shortcuts and Settings#
| Shortcut | Function |
|---|---|
| F9 | New order |
| Ctrl+U | Symbols window |
| Ctrl+M | Show/hide Market Watch |
| Ctrl+N | Show/hide the Navigator |
| Ctrl+T | Show/hide the Toolbox |
| Ctrl+I | List of indicators on the chart |
| F8 | Chart properties (colors, Ask line) |
| Alt+1 / Alt+2 / Alt+3 | Bars / candlesticks / line |
| + / − | Zoom the chart in and out |
| Ctrl+D | Data Window (candle values under the cursor) |
| Ctrl+G | Show/hide the grid |
| F11 | Full screen |
| Ctrl+O | Options |
| Alt+R | Tile charts side by side |
One Click Trading#
The SELL / BUY panel on the chart executes a trade instantly, with no confirmation window, no stop loss and no take profit. It is fast, but it is the most common source of accidental trades. We recommend keeping it switched off until you have mastered the platform: right-click the chart → One Click Trading, or go to Tools → Options → Trade.
Settings worth adjusting#
- Tools → Options → Trade: the default order volume (set it to 0.01).
- Tools → Options → Charts: show trade levels (position and order lines on the chart).
- View → Languages: the platform language, including Arabic.
- Templates: once a chart is set up with your indicators, right-click → Templates → Save Template, so you can apply it to any chart with one click.
Chapter 14
MetaTrader 5 on Your Phone#
The same app runs on iPhone and Android, with five main sections in the bottom bar (names may vary slightly between versions).
| Section | What it contains |
|---|---|
| Quotes | Market Watch. Tap a symbol to see the options: new order, chart, specification. Use the + button to add symbols. |
| Chart | The chart, with the timeframe at the top, indicators under the f button, and a new order under the + button. |
| Trade | Account figures at the top, then open positions and pending orders. Long-press a position to modify or close it. |
| History | Closed trades and deposits, with a period selector. |
| Messages / Settings | Messages, accounts (add or switch accounts) and settings. |
Logging in from your phone#
- Settings → New Account → search for your broker's name.
- Choose “Login to an existing account”, select the correct server, and enter your account number and password.
- Or scan the QR code shown when the account is opened on your computer (screenshot in Chapter 2).
A mistaken tap is easier on a small screen. Check the volume, stop loss and take profit before every confirmation, enable a screen lock on your phone, and never save your trading password on a device that someone else uses.
Chapter 15
Common Error Messages#
| Message | Cause | Fix |
|---|---|---|
| Invalid stops | The stop loss or take profit is on the wrong side, or closer than the “Stops level”. | Check the side (a buy stop loss goes below the price) and the specification. |
| Not enough money | Free margin is insufficient for the requested volume. | Reduce the volume. |
| Market closed | Outside the symbol's trading hours, or a holiday. | Check Sessions in the specification. |
| Invalid volume | The volume is below the minimum or does not match the volume step. | Check Minimal volume and Volume step. |
| Trade disabled | Trading on the symbol is suspended, or you are logged in read-only (Investor). | Make sure you logged in with the trading password. |
| Requote / Off quotes | The price moved before execution. | Try again; if it happens often, look into your broker's execution quality and slippage. |
| No connection | No connection to the server (bottom right of the platform). | Check your internet connection and the server name, or right-click the icon → Rescan servers. |
Chapter 16
Checklist Before Your First Live Trade#
| Question | |
|---|---|
| ☐ | I downloaded the platform from my broker's website or the official website, and the title bar shows a Real account on my broker's server. |
| ☐ | I have read the symbol's specification: contract size, value per move, margin, swaps and trading hours. |
| ☐ | I know the difference between the eight order types and when to use each one. |
| ☐ | I have opened, modified and closed trades on the demo account, and practised partial closes. |
| ☐ | I calculate my position size from my stop loss and my risk per trade (see our article “How to Size Your Position”). |
| ☐ | Every trade has a stop loss placed at the moment it is opened, and I check its dollar value in the order window. |
| ☐ | One Click Trading is switched off, and the default volume is 0.01. |
| ☐ | I know where to find the History and the Journal, and how to export the report. |
| ☐ | My trading password is known to me alone. |
This guide is educational and is not investment advice. The screenshots were taken from the generic version of the MetaTrader 5 platform on a demo account on the MetaQuotes demo server; the interface and specifications may differ at your broker. MetaTrader is a trademark of MetaQuotes, which has no affiliation with Consultya. Trading leveraged CFDs carries a high risk of losing capital.
© 2026 Consultya · info@consultya.co · This guide is educational and is not investment advice.